ECG Changes in Myocardial Infarction: Lead-Wise Localisation for NEET PG
Reflex · 27 Oct 2026 · 14 min read
Last updated: 27 Oct 2026
On this page
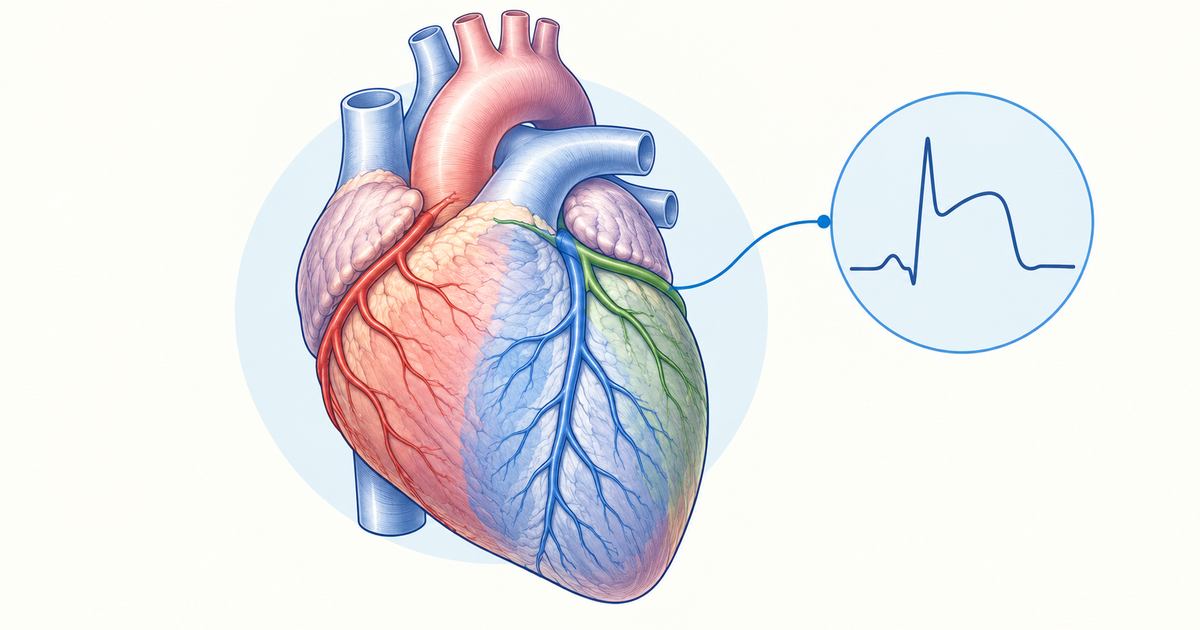
With an MI tracing in front of you, you need to do two things: read the stage of the ECG, and name the artery from the leads. Both skills come down to a short list of patterns that you can memorise once and apply quickly. This guide organises the ECG changes in MI around those two tasks, with the lead-wise localisation table as the centrepiece.
Definitions here follow the Fourth Universal Definition of Myocardial Infarction (Thygesen et al., Eur Heart J 2019), while the ST-elevation cut-offs come from the 2017 ESC STEMI guideline and the MSD Manual. Findings that rest on one small series are flagged as such.
Key Takeaways
The usual evolution is hyperacute T waves, then ST elevation, then Q waves, with T-wave inversion that can last for months.
STEMI needs new ST elevation in two or more contiguous leads (or a new bundle branch block with an ischaemic repolarisation pattern).
Use 1 mm J-point elevation in all leads except V2-V3, where the threshold depends on sex and age.
Localise by lead group: V1-V4 points to the LAD, I/aVL to the LCx or a diagonal branch, and II/III/aVF most often to the RCA.
Look for reciprocal ST depression in the opposite leads; it supports the diagnosis but its absence does not exclude MI.
STEMI equivalents (posterior MI, Wellens, de Winter, LBBB with Sgarbossa features, hyperacute T waves) can appear without classic ST elevation.
Stages of ECG Changes in MI Over Time
The ECG changes in MI follow a recognisable order: peaked T waves and ST elevation first, then Q waves, then T-wave changes that settle slowly. In transmural infarcts, ST elevation appears first and abnormal Q waves develop later, and new abnormal Q waves over a few days support the diagnosis (MSD Manual, Acute MI). Nikus and colleagues describe the same stages, from peaked T waves and ST elevation, through deep Q waves with ST elevation, to biphasic or negative T waves (Nikus et al., 2014).
The table below summarises the approximate timing. Timing varies between patients and with reperfusion, so learn the order rather than the clock.
| Stage | Typical ECG finding |
|---|---|
| Early | Hyperacute (peaked) T waves, then ST elevation |
| Evolving | ST elevation persists while necrosis establishes |
| Days | Abnormal Q waves develop; in inferior MI the ST elevation falls as Q waves form |
| Weeks to months | Q waves usually persist as scar; T-wave inversion may last for months |
Source: synthesis of MSD Manual and Nikus et al., 2014.
Two points help in exam stems. First, the T waves can look normal for a while during ongoing pain (pseudonormalisation), so a single tracing can mislead (Nikus et al., 2014). Second, the rise in troponin lags behind the injury, so treatment should not wait for a normal initial troponin (MSD Manual).
Memory aid (not from a textbook): "Tall T, then ST up, then Q down, T inverts."
Hyperacute T Waves
Hyperacute T waves are the earliest described sign of MI and are short-lived. They are prominent, symmetrical T waves in at least two contiguous leads, and they may come before any ST elevation (Fourth Universal Definition). They evolve rapidly into ST elevation and are most evident in the anterior chest leads (Perm J 2015, ECG Diagnosis: Hyperacute T Waves). Hyperkalaemia can mimic them, so check the clinical context.
Q Waves and Necrosis
New Q waves indicate myocardial necrosis, although transient Q waves can occur during ischaemia or reperfusion. They are most specific when they appear in several leads or lead groupings, or when they are longer than 0.04 s. Minor Q waves of 0.02 to under 0.03 s and at least 1 mm deep suggest a prior MI if the T waves in the same lead group are inverted (Fourth Universal Definition).
The pathological Q-wave criteria, as restated from the Fourth Universal Definition, are listed below (Diagnostics 2021, PMC8146038):
| Leads | Pathological Q wave |
|---|---|
| V2-V3 | Any Q wave of 0.02 s or longer, or a QS complex |
| I, II, aVL, aVF, V4-V6 | Q wave of 0.03 s or longer and at least 1 mm (0.1 mV) deep, or a QS complex |
The finding must be present in two contiguous leads of a grouping: I and aVL, V1-V6, or II, III and aVF. Pathological Q waves often develop over time but are not required for the diagnosis (MSD Manual).
T-Wave Inversion
Symmetrical, often deep T-wave inversion (more than 2 mm) in the anterior precordial leads is associated with LAD occlusion (Fourth Universal Definition). In the evolving picture, T-wave inversion follows the ST elevation, and the changes continue slowly for months.
ST Elevation in MI: Thresholds You Need to Know
ST elevation counts as STEMI only when it is new and present in two or more contiguous leads. The Fourth Universal Definition also accepts a new bundle branch block with an ischaemic repolarisation pattern. Measure at the J point, and compare with a previous ECG when you have one.
| Leads | New J-point elevation threshold |
|---|---|
| All leads except V2-V3 | 1 mm (0.1 mV) or more |
| V2-V3, men aged 40 or older | 2 mm or more |
| V2-V3, men under 40 | 2.5 mm or more |
| V2-V3, women | 1.5 mm or more |
| V7-V9 (posterior leads) | 0.5 mm or more |
| V3R-V4R (right-sided leads) | About 0.5 to 1 mm, depending on the source |
The exact V2-V3 figures come from the 2017 ESC STEMI guideline and the MSD Manual. The Third Universal Definition values, as summarised by Nikus et al., 2014, agree with them. The Fourth Universal Definition supplies the 1 mm rule and the same sex- and age-dependent pattern, noting that healthy young men can show up to 2.5 mm. The V7-V9 value comes from the ESC guideline. None of these cut-offs apply when left ventricular hypertrophy (LVH) or left bundle branch block (LBBB) is present. For the right-sided leads the sources do not agree: the Fourth Universal Definition gives 0.5 mm, but one 2022 review used 1 mm (Intern Med 2022, PMC8907765).
The V2-V3 numbers matter because healthy young men can show up to 2.5 mm of normal-variant elevation there (Fourth Universal Definition). Using 1 mm in V2-V3 will over-call benign elevation. If a prior ECG exists, new J-point elevation of 1 mm or more in V2-V3 compared with that tracing is considered ischaemic.
Left bundle branch block, LVH and paced rhythm distort these thresholds; see the STEMI equivalents section below.
Lead-Wise Localisation of ECG Changes in MI
The localisation table is the most practical part of this topic. Find the leads with ST elevation, read off the territory, then name the usual artery. The reciprocal column is your cross-check.
| Territory | ST elevation leads | Reciprocal ST depression | Usual artery |
|---|---|---|---|
| Septal and anterior | V1-V4 (V1-V2 septal, V3-V4 anterior); V5-V6 may join in extensive infarcts | Not listed | LAD |
| Lateral | I, aVL (with V5-V6 in lateral extension) | III and aVF (II in some series) | LCx or a diagonal branch |
| Inferior | II, III, aVF | aVL, often I | Most often RCA (roughly 70-90% in one series); dominant LCx in a minority |
| Posterior | V7-V9 | ST depression with tall R wave in V1-V3 | LCx; RCA if right-dominant |
| Right ventricle | V3R-V4R, with V1 changes in inferior MI | No fixed rule; aVL and I depression may accompany an RCA-related inferior STEMI | Proximal RCA |
Sources: lead groups from Nikus et al., 2014; arteries from MSD Manual, Open Heart 2023, ESC 2017 and PMC11160525. Reciprocal changes: LITFL, Inferior STEMI, LITFL, Lateral STEMI and Singh et al., 2021; RV infarction from LITFL, RV infarction. Cross-check the table against your standard medicine textbook before exam day.
Memory aids (not from a textbook):
- Territory groups: septal V1-V2, anterior V3-V4, lateral I and aVL (plus V5-V6), inferior II/III/aVF.
- Arteries: LAD covers anterior and septal; LCx covers lateral and posterior; RCA covers inferior and the right ventricle, most often.
- Mirror pairs: inferior mirrors aVL (and I), lateral mirrors III/aVF, posterior mirrors V1-V3.
Anterior and Septal MI
Anterior infarction usually reflects obstruction of the left coronary artery, especially the anterior descending branch (MSD Manual). Septal leads are V1-V2 and anterior leads are V3-V4 (Nikus et al., 2014). The Fourth Universal Definition also links aVR elevation (more than 1 mm) with LAD occlusion, in most cases, and with higher 30-day mortality (Fourth Universal Definition).
Lateral and High Lateral MI
Lateral MI shows ST elevation in I and aVL, with V5 and V6 when the lateral wall is more extensively involved. Leads I and aVL view the basal lateral free wall, which is supplied by the first diagonal, the first obtuse marginal and the ramus intermedius. In one single-centre study of 54 patients with isolated I/aVL STEMI, the first diagonal was the commonest culprit, followed by the LCx obtuse marginal and then the ramus (Singh et al., Cardiol Res Pract 2021). That is why the table says "LCx or a diagonal branch".
Inferior MI: RCA or LCx?
Inferior ST elevation in II, III and aVF is usually from the RCA or, less often, a dominant LCx. In a 2023 series, the RCA supplied roughly 70-90% of inferior STEMIs and the distal LCx about 8-15% (Open Heart 2023).
One clue is the relative height of ST elevation in leads III and II. ST elevation in III greater than in II favours the RCA. ST elevation in II greater than in III favours the LCx, but with low predictive value, and this comes from a single-centre series (Open Heart 2023). Use it as a supporting clue only.
Right Ventricular Infarction
Suspect RV infarction in any inferior MI. The Fourth Universal Definition links inferior STEMI plus changes in V3R/V4R, aVR or V1 with RV involvement. The culprit is usually the proximal RCA or one of its marginal branches (MSD Manual). Changes in the right-sided leads can be transient, and a normal V3R/V4R does not exclude RV infarction.
Posterior MI
Posterior MI shows horizontal ST depression with a prominent R wave in V1-V3, because those leads look at the posterior wall from the front. The circumflex is usually the culprit, or the RCA if the system is right-dominant (ESC 2017; PMC11160525).
Record V7-V9 to confirm: V7 sits at the left posterior axillary line, V8 at the left mid-scapular line, and V9 at the left paraspinal border, all at the fifth intercostal space. The Fourth Universal Definition warns that V1-V3 ST depression is non-specific, so do not exclude STEMI on those leads alone (Fourth Universal Definition).
Reciprocal Changes in MI
Reciprocal ST depression appears in leads facing away from the infarcting wall. Inferior MI gives depression in aVL, and often in I; absence of lead I depression favours a circumflex culprit (LITFL, Inferior STEMI). Lateral MI gives depression in the inferior leads III and aVF, seen when I and aVL show ST elevation, and it may be hidden by concomitant inferior elevation (LITFL, Lateral STEMI). Posterior MI gives depression in V1-V3. In RV infarction, reciprocal depression in aVL and I may accompany an RCA-related inferior STEMI (LITFL, RV infarction).
These changes are common but not universal. Reciprocal changes are seen in about 70% of inferior and 30% of anterior STEMIs (RCEM Learning), so their absence does not rule out an infarct. In the high lateral study above, depression in II, III and aVF was largely reciprocal to the lateral or anterolateral infarct (Singh et al., 2021).
STEMI Equivalents: ECG Changes in MI Without Classic ST Elevation
Several patterns carry the same urgency as STEMI even when the ST elevation criteria are not met. The table below lists the main ones.
| Pattern | Key ECG features | Suggests |
|---|---|---|
| Posterior MI | ST depression V1-V3; ST elevation 0.5 mm or more in V7-V9 | LCx occlusion (RCA if right-dominant) |
| Wellens syndrome | Deeply inverted or biphasic T waves in V2-V3; ST isoelectric or elevated less than 1 mm | Critical proximal LAD stenosis |
| de Winter pattern | Upsloping J-point depression of 1-3 mm in V1-V6 (typically V1-V4), tall symmetric T waves, aVR elevation above 0.5 mm | Usually LAD occlusion |
| LBBB with Sgarbossa features | Concordant ST changes (see below) | Acute ischaemia |
| Hyperacute T waves | Prominent symmetrical T waves in contiguous leads | Very early MI |
| Widespread ST depression with aVR/V1 elevation | ST depression in many leads with ST elevation in aVR or V1 | Multivessel or left main disease |
Wellens Syndrome
Wellens syndrome is a pattern of deeply inverted or biphasic T waves in V2-V3, which may extend across V1-V6. The patient is typically pain-free when the ECG is recorded, the ST segment is isoelectric or elevated less than 1 mm, and there are no precordial Q waves with preserved R-wave progression (LITFL, Wellens syndrome).
There are two types. Type A, with biphasic T waves, accounts for about 25% of cases, and type B, with deep symmetrical inversion, for about 75% (LITFL, Wellens syndrome; PMC8762150). The pattern points to critical proximal LAD stenosis, but it is not exclusive to the LAD, because RCA or LCx lesions and vasospasm can mimic it. Be cautious with stress testing: patients with this pattern may suffer an MI or arrest.
de Winter Pattern
The de Winter pattern is an anterior STEMI equivalent: instead of the ST elevation you would expect, the chest leads show upsloping ST depression with tall T waves, and it is managed exactly like a STEMI. According to a 2026 scoping review of the original 2008 study, roughly 2% of anterior MIs show it, and in about 88% of those cases the culprit vessel was the LAD (World J Cardiol 2026, PMC12896948).
Recognise it by these features:
- Upsloping J-point depression of 1-3 mm in V1-V6 (typically V1-V4).
- Tall, symmetric, peaked T waves that follow the depressed segment.
- Mild ST elevation in aVR (above 0.5 mm).
- A QRS that is normal or mildly prolonged.
LBBB and the Sgarbossa Criteria
LBBB by itself does not make a STEMI equivalent (MSD Manual). What raises concern is ST elevation of at least 1 mm that is concordant with the QRS in any lead, which may indicate acute ischaemia. A presumed new LBBB that is not rate-related also carries an adverse prognosis (Fourth Universal Definition).
In the original Sgarbossa score, excessively discordant ST elevation above 5 mm scores 2, ST depression above 1 mm concordant with the QRS in V1-V3 scores 3, and concordant ST elevation above 1 mm scores 5.
When the total reached 3 or more, specificity was about 90%, but sensitivity was only about 36% (LITFL, Sgarbossa criteria). In the Smith-modified version, an ST/S ratio of 0.25 or more (with at least 1 mm of ST elevation) takes the place of the fixed 5 mm discordance criterion, while the concordant ST elevation and concordant V1-V3 ST depression criteria stay as they were. Remember that ventricular pacing produces a LBBB-like tracing, so the criteria are less specific in paced rhythm.
Widespread ST Depression with aVR Elevation
ST depression in many leads with aVR/V1 elevation suggests multivessel or left main disease (2017 ESC STEMI guideline). Treat it as a high-risk tracing even though it does not meet standard ST-elevation criteria in the other leads.
Practising ECG Changes in MI
Reading the tracing before looking at the options is the habit that pays off most. Count ST elevation in two contiguous leads, apply the V2-V3 sex and age cut-offs, then look for reciprocal depression and record V7-V9 when V1-V3 show ST depression. Think of RV infarction in any inferior MI, and remember that LBBB, LVH and paced rhythm change which criteria apply.
Take an exam stem that describes ST depression in aVL alongside ST elevation in II, III and aVF. This is an inferior MI, and before you settle on an answer you should look at V3R-V4R for RV involvement.
For more cardiology revision, work through the cardiology practice questions, and use the NEET PG question bank for wider practice.
Conclusion
The ECG changes in MI reward a two-step habit: stage the tracing by its evolution, then localise it by the leads. Learn the localisation table with its reciprocal column, apply the V2-V3 thresholds carefully, and keep the STEMI equivalents in mind for the stems that hide the ST elevation. Practise with real tracings until the patterns feel automatic.
Practise this on Reflex
Turn what you just read into recall with 14 years of tagged PYQs.
FAQ
Frequently asked questions
The questions aspirants ask most about this topic.
The usual sequence is hyperacute T waves, then ST elevation, then abnormal Q waves over the following days, with T-wave inversion that can last for months. Q waves usually persist as a scar. Troponin rises later than the injury, so the ECG matters most in the first hours.
Inferior MI shows ST elevation in leads II, III and aVF, and the culprit is most often the right coronary artery, with a dominant left circumflex in a minority. ST elevation in III greater than in II favours the RCA. Record right-sided leads such as V4R to look for right ventricular involvement.
For V2-V3, the new J-point elevation must reach 2.5 mm in men under 40, 2 mm in men aged 40 or older, and 1.5 mm in women. All other leads use the lower cut-off of 1 mm. Whichever threshold applies, the elevation must be present in two contiguous leads to count. These values apply when LVH and LBBB are absent.
Posterior MI shows horizontal ST depression with a prominent R wave in V1-V3. Confirm it by recording posterior leads V7-V9, where ST elevation of 0.5 mm or more supports the diagnosis. ST depression in V1-V3 alone is non-specific, so do not use it to exclude STEMI.
STEMI equivalents include posterior MI, Wellens syndrome (deep or biphasic T waves in V2-V3), the de Winter pattern (upsloping J-point depression with tall symmetric T waves in the precordial leads), LBBB with Sgarbossa features, and hyperacute T waves. A new LBBB alone is not a STEMI equivalent.
Stay ahead in your preparation
Get expert tips, exam updates, and high-yield insights delivered straight to your inbox.
No spam. Unsubscribe anytime.
More in Medicine
View all → Medicine
Nephrotic Syndrome vs Nephritic Syndrome: The Proteinuria Threshold That Explains Everything Else
 Medicine
Murmur Grading for NEET PG: The Levine Scale, and Why Louder Doesn't Always Mean Worse
 Medicine
Anemia Classification for NEET PG: Morphological Types, Iron Studies, and the Differentials Examiners Actually Test
Anemia questions cut across Medicine, Pathology, Pediatrics and Obstetrics, and most of them hand you a hemogram and expect you to name the type on sight. The morphological classification, the iron studies table, and the smear clues that separate the differentials.
 Medicine
Jaundice Types for NEET PG: Pre-Hepatic, Hepatic, and Post-Hepatic Classification
Jaundice classification for NEET PG — pre-hepatic, hepatic, and post-hepatic types, the lab pattern that tells them apart, and Courvoisier's law explained.