Frank-Starling Law for NEET PG: The Curve, Its Mechanism and What Shifts It
Reflex · 10 Nov 2026 · 12 min read
Last updated: 10 Nov 2026
On this page
The Frank-Starling law says that, within physiological limits, the more the ventricular muscle is stretched before it contracts, the stronger the contraction and the larger the stroke volume. Frank and Starling worked largely independently, and the principle now carries both their names (OpenStax Anatomy and Physiology 2e, 19.4 Cardiac Physiology). The sentence is easy to memorise. The harder part is the curve: what each axis means, what moves you along it, and what shifts the whole curve up or down.
This post builds that picture step by step. It covers preload and stroke volume, the shape of the curve, the cellular mechanism, the factors that shift it, the failing heart, and the Anrep effect, which is easy to confuse with the Frank-Starling law.
Key Takeaways
The Frank-Starling law: greater end-diastolic stretch of the ventricle gives a stronger contraction and a larger stroke volume, within physiological limits.
Preload is end-diastolic volume. A change in preload moves the heart along one curve; a change in contractility shifts the whole curve.
Positive inotropes (sympathetic stimulation, high calcium, thyroid hormones) shift the curve up. Parasympathetic activity, hypoxia, acidosis, hyperkalaemia, beta blockers and calcium channel blockers shift it down.
In heart failure the curve moves down and flattens, so the same preload produces less output and gains less as preload rises.
The mechanism sits in the myofilaments: length-dependent activation, with titin acting as a stretch sensor and Ca2+ sensitivity rising with sarcomere length.
Frank-Starling responds to preload within 2-3 beats. The Anrep effect responds to a sustained rise in afterload over minutes.
What does the Frank-Starling law state?
The law states that the force of ventricular contraction depends on how far the fibres were stretched during filling. Frank studied isolated perfused frog hearts. Starling used anaesthetised dogs and showed that the relationship operates in the intact body, beat to beat. Both saw it as the length dependence of active force, as in skeletal muscle (Cardiac thin filament regulation and the Frank-Starling mechanism, J Physiol Sci 2014).
Starling's own wording was that the energy of contraction is a function of the length of the muscle fibre. He built on earlier work by Blix (1893) and Frank (1899). You will also see the older name, the ventricular function curve (Cardiac efficiency and Starling's Law of the Heart, J Physiol 2022).
Why the body needs it
The law adjusts cardiac output to venous pressure from one beat to the next. It also keeps right and left heart outputs equal, so blood does not pile up in the lungs or the systemic veins (Biophys Rev 2017). It operates in healthy humans across a wide range of exercise levels, so it is not a reserve mechanism that only appears in disease.
Preload, end-diastolic volume and stroke volume
Preload is the end-diastolic volume (EDV), the volume in the ventricle at the end of filling. Stroke volume is the volume ejected per beat: SV = EDV - ESV, where ESV is the end-systolic volume left behind. Stroke volume is governed by three things: preload, contractility and afterload (OpenStax).
Venous return sets EDV, while afterload is the pressure the ventricle must work against (Annu Rev Physiol 2025). For resting adult values, OpenStax gives:
| Parameter | Typical value (range) |
|---|---|
| Stroke volume | About 70 mL (55-100 mL) |
| Heart rate | About 75 beats/min (60-100) |
| Cardiac output | Mean 5.25 L/min (4.0-8.0) |
| Ejection fraction | About 55-70% (mean 58%) |
| Exercise: heart rate / stroke volume / cardiac output | Up to 150 / about 130 mL / about 19.5 L/min |
What changes preload
Several everyday factors push EDV up or down, and each one changes where the heart sits on the curve (OpenStax):
- Faster heart rate: filling time shortens, so EDV falls.
- Atrial contraction: the atrial kick supplies the last 20-30% of ventricular filling.
- Sympathetic venous stimulation: raises venous return, EDV and preload.
- Acute afterload rise: ejection is reduced and chamber volume expands, so preload rises as a consequence (Annu Rev Physiol 2025).
The Frank-Starling curve explained
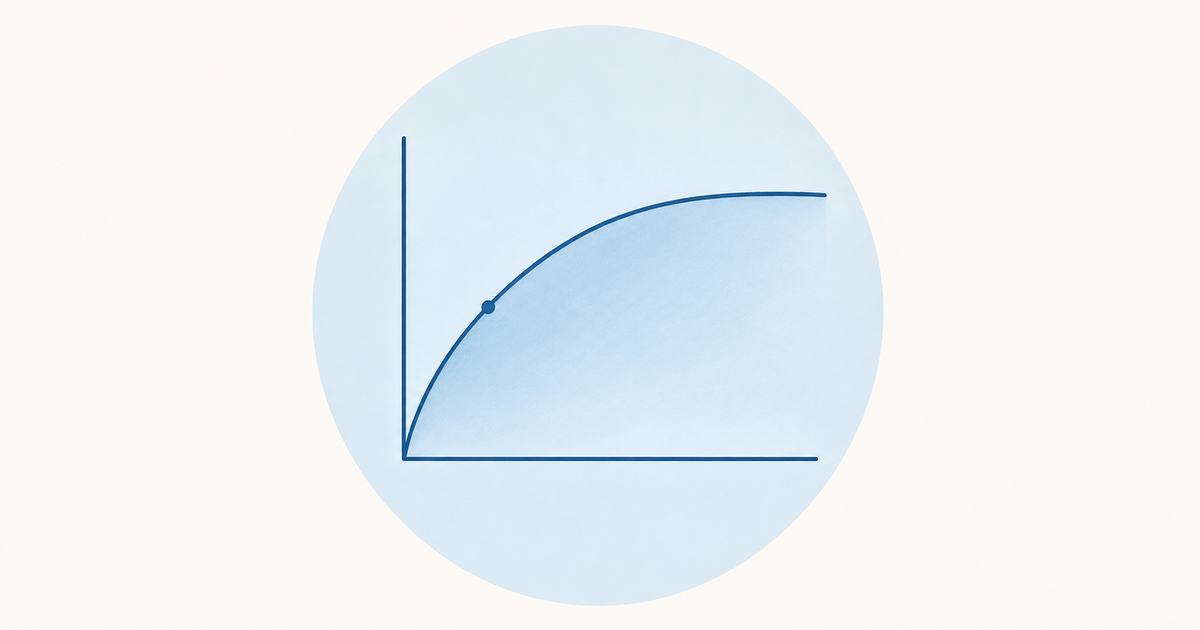
On the ventricular function curve, output rises as preload rises, then levels off, and in the classic textbook drawing eventually falls (Merck Manual Professional, Frank-Starling Principle). Read it as "more filling, more output, with diminishing returns".
The axes vary between books. The y-axis may be stroke volume, cardiac output or stroke work. The x-axis may be end-diastolic volume, filling pressure or fibre length (J Physiol 2022). Learn the relationship, not one fixed labelling.
The descending limb
The falling part of the curve is best treated as theoretical or experimental. Stretch beyond the optimal sarcomere length would reduce force, but OpenStax notes that the heart's physical location limits excessive stretch, so it is not a concern in the body (OpenStax). If you are asked to draw the curve, draw the rise and the plateau confidently and label the descending limb as the experimental extension.
Why the ventricle resists over-filling
The end-diastolic pressure-volume relationship (EDPVR) is exponential. The ventricle is compliant at low volumes and stiffer at high volumes. Titin elasticity predominates at shorter sarcomere lengths, and collagen takes over at longer lengths (Commun Med 2026). This stiffening is part of why the working heart operates on the rising and flattening portions of the curve.
How does stretch produce a stronger contraction?
The effect begins inside the myofilaments, and it is called length-dependent activation. It has been shown in whole hearts, trabeculae, single cardiomyocytes and even a single myofilament, so it does not depend on the whole organ. The mechanisms are not fully understood and are unlikely to be a single process (Annu Rev Physiol 2025).
Ideas that were tried and set aside
Two older explanations are worth knowing so you can recognise them:
- Filament overlap: at short sarcomere lengths, stretch increases overlap. It cannot explain the effect at longer lengths.
- Lattice spacing: stretch narrows the cell and brings filaments closer, which was proposed to raise cross-bridge probability and Ca2+ sensitivity. This dominated thinking until the late 1990s. X-ray work in 2000-2003 showed that Ca2+ sensitivity is not linearly related to spacing, so at best it is secondary (Biophys Rev 2017).
The current picture: titin and calcium sensitivity
Titin (3.8 MDa) spans from the Z-disc to the M-band. Its I-band region is an extensible spring and a length-dependent mechanosensor. Stretch changes thick-filament structure and recruits cross-bridges, and titin-mediated effects rather than filament spacing appear primarily responsible. The effect varies with titin isoform (Biophys Rev 2017).
Calcium sensitivity also rises with sarcomere length, seen as a leftward shift of the tension-pCa curve (Annu Rev Physiol 2025). Remember the thin-filament switch: Ca2+ binds troponin C, troponin I leaves actin, and tropomyosin exposes the myosin-binding sites. Cardiac troponin C has one regulatory Ca2+ site, so cooperativity is lower than in fast skeletal muscle.
Cardiac myofilaments are only partly activated even at peak systole, which leaves room for activation to rise with length (J Physiol Sci 2014). Cardiac myosin-binding protein C may act as a strain sensor, and phosphorylation of it regulates the sarcomere-length dependence of force (J Gen Physiol 2021).
Two phases and the time scale
In ferret ventricular muscle, stretch produced two phases. A rapid phase, independent of intracellular Ca2+, underlies the beat-to-beat Frank-Starling response. A slower phase follows a rise in Ca2+ through release from the sarcoplasmic reticulum (J Physiol Sci 2014). The full effect develops within 2-3 consecutive cycles (Annu Rev Physiol 2025). In the physiological range of 80-100% of optimal length, the length dependence is more pronounced in cardiac than in skeletal muscle.
What shifts the Frank-Starling curve up or down?
A preload change moves the operating point along one curve. A change in contractility (the inotropic state) shifts the whole curve. Force generation reflects the combination of EDV and contractile state (Annu Rev Physiol 2025).
| Direction | Factors (OpenStax) |
|---|---|
| Curve shifts up (positive inotropy) | Sympathetic stimulation, epinephrine, norepinephrine; high calcium; thyroid hormones; glucagon; dopamine, isoproterenol; digitalis |
| Curve shifts down (negative inotropy) | Parasympathetic stimulation (acetylcholine); hypoxia; acidosis; hyperkalaemia; beta blockers; calcium channel blockers |
Source: OpenStax Anatomy and Physiology 2e, 19.4. Hyperkalaemia is linked to a weak, flaccid heart, which fits its place on the lower list.
A quick reasoning drill
If a stem describes a patient whose stroke volume rises because venous return rose, think "movement along the same curve". If it describes a drug or hormone that raises stroke volume at the same filling, think "curve shifted up". Practising this split before reading the options keeps preload and contractility from blurring together.
Shifting curves appear elsewhere in physiology too; the oxygen-hemoglobin dissociation curve and its shifts is a useful parallel to practise the same "move along versus shift" reasoning.
Where afterload fits
Higher resistance or semilunar valve stenosis raises afterload and reduces stroke volume. Lower resistance raises it (OpenStax). An acute afterload rise shifts the pressure-volume loop to the right with a larger EDV, which engages the Frank-Starling mechanism. Mechanical performance and energetics depend on both preload and afterload (J Physiol 2022).
Frank-Starling law in heart failure
In heart failure the whole curve shifts down and flattens. At any given preload the output is lower, and each extra unit of preload buys less additional output. Treatment can partly restore the curve (Merck Manual Professional).
Two points sharpen this. First, length-dependent activation is reduced or absent in certain pathologies such as heart failure (Annu Rev Physiol 2025). Second, the law still operates in diseased hearts: the slope is less steep, and the link between ventricular volume and output is blunted as disease progresses (J Physiol Sci 2014).
Ventricular-arterial coupling
In the pressure-volume framework, arterial elastance (Ea) rises with vascular stiffness and neurohormonal activation, while end-systolic elastance (Ees) falls with impaired contractility. The result is unfavourable ventricular-arterial coupling (Commun Med 2026). Some thin-filament mutations, such as cTnI R145W, can impair length-dependent activation, although the mechanism is debated.
Lowering afterload improves stroke volume (OpenStax). That follows directly from the curve: when the ventricle faces less resistance, it ejects more of what it filled with.
Frank-Starling law versus the Anrep effect
The two are easy to mix up because both keep stroke volume steady when loading changes. Frank-Starling responds to a rise in preload, while the Anrep effect responds to a sustained rise in afterload. The table summarises the contrast (Annu Rev Physiol 2025).
| Feature | Frank-Starling | Anrep |
|---|---|---|
| Trigger | Increase in preload (stretch, EDV) | Sustained increase in afterload |
| Speed | Within 2-3 beats | Over a few minutes |
| Ca2+ transient | No rise needed for the initial effect | Needs a rise in the Ca2+ transient |
| Basis | Length-dependent | Stress-dependent |
The time scales differ about 10-fold. The two act in tandem and are dynamically linked: Frank-Starling raises Ca2+ sensitivity, which amplifies the Ca2+ rise of the Anrep effect, and the Anrep force then brings EDV back toward baseline. In mice after acute transverse aortic constriction, EDV was up at 1 minute (Frank-Starling), but by 30 minutes it was near baseline while pressure stayed high, which was attributed to the Anrep effect.
The Anrep mechanisms are still debated. Proposed contributors include stretch-activated channels, angiotensin II, the Na+-H+ exchanger, reactive oxygen species, TRPC6 and thrombospondin 4.
Function curve versus pressure-volume loop
The function curve and the pressure-volume (PV) loop show the same physiology at different scales. The function curve plots output against preload across many beats. The PV loop plots pressure against volume within one beat (Commun Med 2026).
The loop runs counterclockwise through diastolic filling, isovolumic contraction, ejection and isovolumic relaxation, and its area is the stroke work. The upper-left boundary is the end-systolic pressure-volume relationship (ESPVR), whose slope Ees is a relatively load-independent index of contractility. The lower boundary is the EDPVR.
A preload change moves the loop along the EDV axis and changes stroke volume. A contractility change shifts the ESPVR slope. The ESPVR itself is built from end-systolic points across a preload reduction, and each point reflects length-dependent activation. In coupling terms, stroke work is greatest when Ea/Ees is about 1.0, while efficiency peaks at about 0.5-0.6. For the phases of the loop, revisit the cardiac cycle and Wiggers diagram.
Clinical use: fluid responsiveness
The curve explains why the same filling pressure can mean different things in different patients. In ventilated patients, positive-pressure breaths cyclically change right and left ventricular loading. A larger swing in stroke volume across a breath makes a response to fluid more likely (Ann Transl Med 2018).
Two patients with the same central venous or wedge pressure can be responder or non-responder, depending on the slope of their own curve. Fluid responsiveness is a physiological state, not an indication to give fluids. The same review notes limitations in spontaneous breathing, low tidal volume and arrhythmia, and reports that about half of critically ill patients are fluid unresponsive.
Common mistakes with the Frank-Starling law
- Treating preload and contractility as one thing. Preload slides along the curve; contractility moves the curve.
- Calling the law a disease mechanism only. It works in healthy people across exercise levels.
- Drawing the descending limb as normal physiology. Present it as the experimental extension.
- Mixing up Anrep and Frank-Starling. Preload and 2-3 beats versus afterload and minutes.
- Forgetting the axes vary. State what your y-axis and x-axis are whenever you draw the curve.
Conclusion
The Frank-Starling law connects ventricular stretch to stroke volume, and the whole topic reduces to two questions: did the point move along the curve, or did the curve itself shift? Preload moves the point, contractility shifts the curve, and heart failure drops and flattens it. Underneath, titin and rising Ca2+ sensitivity make the myofilaments respond to length.
To consolidate, draw the curve from memory with both a healthy and a failing line, then write the Anrep contrast beside it. When you are ready to test yourself, work through the physiology cardiovascular practice questions.
Practise this on Reflex
Turn what you just read into recall with 14 years of tagged PYQs.
FAQ
Frequently asked questions
The questions aspirants ask most about this topic.
Within physiological limits, the more the ventricular muscle is stretched during filling, the stronger it contracts and the larger the stroke volume. It adjusts cardiac output to venous return beat by beat and keeps right and left heart outputs equal.
A change in preload (end-diastolic volume) moves the heart to a different point on the same curve. A change in contractility shifts the whole curve: sympathetic stimulation, high calcium and thyroid hormones shift it up, while parasympathetic activity, hypoxia, acidosis, hyperkalaemia, beta blockers and calcium channel blockers shift it down.
The curve shifts down and flattens. Output at any given preload is lower, and a rise in preload adds less output than in a healthy heart. Treatment can partly restore the curve.
It is length-dependent activation of the myofilaments. Titin acts as a stretch sensor that changes thick-filament structure and recruits cross-bridges, and Ca2+ sensitivity rises with sarcomere length. The mechanism is not fully understood and is unlikely to be a single process.
Frank-Starling is triggered by a rise in preload and acts within 2-3 beats without needing a rise in the Ca2+ transient. The Anrep effect is triggered by a sustained rise in afterload, develops over a few minutes and needs a rise in the Ca2+ transient.
Stay ahead in your preparation
Get expert tips, exam updates, and high-yield insights delivered straight to your inbox.
No spam. Unsubscribe anytime.
More in Physiology
View all → Physiology
Cardiac Cycle for NEET PG: A Phase-by-Phase Walkthrough of the Wiggers Diagram
A phase-by-phase walkthrough of the cardiac cycle on the Wiggers diagram, with valve states, heart sounds, ECG timing and JVP waves in revision tables.
 Physiology
Oxygen-Hemoglobin Dissociation Curve for NEET PG: Every Shift Explained
Why the oxygen-hemoglobin dissociation curve is sigmoid, what moves it right or left, and how to apply each shift to fetal hemoglobin, stored blood, altitude and carbon monoxide poisoning.
 Physiology
Reflexes Mnemonic for NEET PG: Deep Tendon and Superficial Reflexes
Nerve root values, the classic root-value mnemonic, and how UMN vs LMN lesions change the reflex pattern.
 Physiology
Tips to Score High in NEET PG/INICET Physiology
Master Physiology for NEET PG/INICET by focusing on conceptual clarity, active MCQ practice, and systematic revision.