Cardiac Cycle for NEET PG: A Phase-by-Phase Walkthrough of the Wiggers Diagram
Reflex · 3 Nov 2026 · 12 min read
Last updated: 3 Nov 2026
On this page
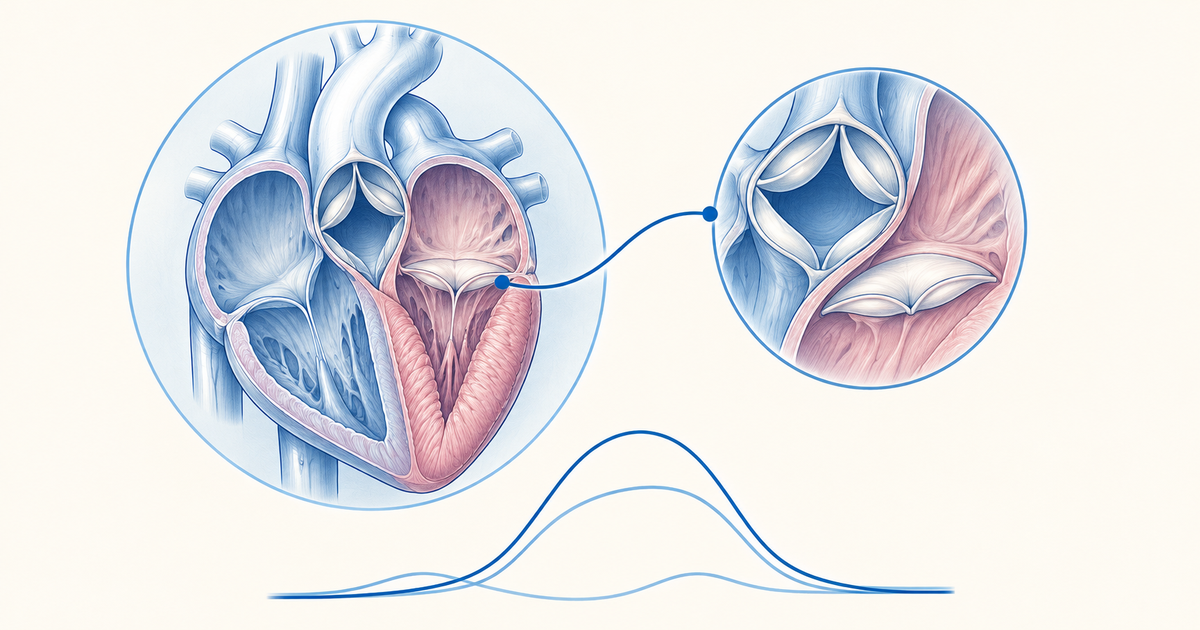
Electrical activity, pressure, volume and valve movement all repeat together with every heartbeat, and that repeating package is the cardiac cycle. The Wiggers diagram places every one of these traces on a single time axis, which is why it looks crowded at first. Once you read it as six phases, each defined by which valves are open, it becomes a short list you can redraw from memory.
This walkthrough follows the order in which the heart actually moves: atrial systole, isovolumic contraction, ejection, isovolumic relaxation, rapid filling and slow filling. For each phase you get the valve state, what the ECG is doing, and which heart sound or jugular wave belongs to it. The timings and volumes come from the OpenStax physiology text and LITFL, and numbers that those sources do not give are left out rather than guessed.
Key Takeaways
The cardiac cycle has two main parts: ventricular systole (isovolumic contraction plus ejection) and ventricular diastole (isovolumic relaxation plus filling), with atrial systole adding the last part of filling.
Isovolumic contraction and isovolumic relaxation are the only phases with all four valves closed and ventricular volume constant.
Pressure decides valve position. Once a ventricle pushes harder than the atrium behind it, the AV valve shuts. Once it pushes harder than the aorta or pulmonary trunk ahead of it, the semilunar valve opens, and each valve closes again when its gradient reverses.
S1 is AV valve closure (start of systole). S2 is semilunar valve closure (start of diastole, and it coincides with the dicrotic notch).
S3 is rapid-filling-phase sound, S4 is atrial contraction against a stiff ventricle and comes before S1.
In a resting standing adult, end-diastolic volume is about 130 mL, stroke volume 70-80 mL and end-systolic volume 50-60 mL.
What the cardiac cycle is and how to read the Wiggers diagram
The cardiac cycle is the sequence of events from the start of one heartbeat to the start of the next. In the OpenStax chapter on the cardiac cycle, it is divided into systole (contraction) and diastole (relaxation) of the chambers (OpenStax Anatomy and Physiology 2e, 19.3). Blood moves only because pressure differences open and close the valves.
A Wiggers diagram has the same horizontal time axis for every trace. Reading from top to bottom, you usually find aortic, left ventricular and left atrial pressure curves, then the ventricular volume curve, the ECG and the phonocardiogram (heart sounds). Place a vertical line at any moment and you can read off every variable at that instant.
A routine for reading any Wiggers diagram
Start with the pressure curves, because valve state is decided by them. Find the point where ventricular pressure crosses atrial pressure, then the point where it crosses aortic pressure. Those crossings mark the four valve events, and the heart sounds, ECG waves and volume changes all hang off them.
Then ask one question at each point: is the ventricular volume changing? If the volume is flat while pressure is rising or falling, you are in an isovolumic phase.
Cardiac cycle timing: how long each phase lasts
The OpenStax text gives the following durations for one cycle: atrial systole lasts about 100 ms and ends before ventricular systole begins, ventricular systole (isovolumic contraction plus ejection) totals about 270 ms, and ventricular diastole (isovolumic relaxation plus filling) lasts about 430 ms (OpenStax, 19.3). The split between systole and diastole depends on heart rate, so treat these as the textbook example and not as a fixed ratio.
One practical point follows from this. Diastole is the longer part of the cycle at rest, and it is the period in which the ventricles fill. That is why very fast heart rates reduce filling time.
Phase-by-phase summary table
The table below is the core revision aid. Each row is one phase of the cycle, with the valve state and the events that belong to it.
| Phase | AV valves | Semilunar valves | Ventricular volume | Key events |
|---|---|---|---|---|
| 1. Atrial systole | Open | Closed | Rises slightly (final top-up) | P wave then atrial contraction; a wave; S4 if present |
| 2. Isovolumic contraction | Close, producing S1 | Closed | Constant | After QRS; ventricular pressure rises; c wave region |
| 3. Ejection | Closed | Open | Falls | Aortic pressure rises; T wave appears late in the phase |
| 4. Isovolumic relaxation | Closed | Close, producing S2 | Constant | End of T wave; dicrotic notch; atria fill (v wave) |
| 5. Rapid ventricular filling | Open | Closed | Rises quickly | Most of the filling; y descent; S3 may occur |
| 6. Slow filling (diastasis) | Open | Closed | Rises slowly | Venous pressure rises slowly; pressure gradient is small |
Sources: OpenStax 19.3; LITFL, Cardiac Cycle. The terms rapid ejection, reduced ejection and diastasis are standard sub-labels used to describe the curve shapes.
Cardiac cycle phase 1: atrial systole
Ventricular filling ends with atrial systole. Atrial depolarisation shows as the P wave on the ECG, and contraction of the atria follows it. Because the semilunar valves are closed and the AV valves stay open, this last volume of blood is added to ventricles that are already mostly full.
According to OpenStax, about 70-80% of ventricular filling is passive and the remaining 20-30% comes from atrial contraction. LITFL gives a lower resting contribution of around 10%, rising in tachycardia. The sources differ, so remember the principle: most filling happens before the atria contract, and the atrial kick matters more when diastole is short or the ventricle is stiff.
Atrial contraction produces the a wave of the jugular venous pulse. A fourth heart sound, when present, is heard during this phase.
Cardiac cycle phase 2: isovolumic contraction
Isovolumic contraction begins as the ventricles start to contract after the QRS complex. The AV valves snap shut the moment ventricular pressure climbs above atrial pressure. The semilunar valves are still closed because ventricular pressure has not yet exceeded aortic or pulmonary trunk pressure.
With all four valves closed, the ventricular blood volume cannot change. That is the meaning of "isovolumic": the muscle is developing tension and pressure, but nothing leaves the chamber. Closure of the AV valves produces the first heart sound, S1.
The c wave coincides with this phase on the jugular tracing. Sources disagree on its cause (a tricuspid bulge into the atrium versus transmitted carotid pulsation), so learn it as a small wave that appears during isovolumic contraction without committing to one mechanism.
Cardiac cycle phase 3: ventricular ejection
Pressure in the aorta and pulmonary trunk is the threshold for ejection: once ventricular pressure rises above it, ejection begins. At that point the semilunar valves open, blood flows out of the ventricles, ventricular volume falls and aortic pressure rises as the blood enters.
The T wave, representing ventricular repolarisation, appears late in this phase. Repolarisation leads into relaxation, so the T wave is the electrical signal that ejection is about to end.
Not all of the blood leaves. In a resting standing adult, end-diastolic volume is about 130 mL and end-systolic volume 50-60 mL, which leaves a stroke volume of 70-80 mL (OpenStax, 19.3). Stroke volume equals end-diastolic volume minus end-systolic volume, which you can use to check any set of numbers in a question stem.
Cardiac cycle phase 4: isovolumic relaxation
Isovolumic relaxation begins at the end of the T wave. As the ventricles relax, their pressure drops under aortic and pulmonary trunk pressure and the semilunar valves close. S2, the second heart sound, is the sound of this closure.
The AV valves have not yet reopened, so again all four valves are closed and ventricular volume is constant. This is the second isovolumic phase. The brief rebound in aortic pressure at valve closure appears on the aortic curve as the dicrotic notch, so the dicrotic notch and S2 mark the same moment (both sources agree: OpenStax; LITFL).
Meanwhile the atria keep filling from the veins while the AV valves are shut. Atrial filling during ventricular systole produces the v wave on the jugular tracing.
Cardiac cycle phase 5: rapid ventricular filling
The AV valves open as soon as atrial pressure is higher than ventricular pressure, and blood moves from the atria down into the ventricles. The initial flow is fast because the atria have been filling and the ventricles are relaxed. Most ventricular filling occurs in this phase.
On the jugular tracing, rapid filling produces the y descent after the tricuspid valve opens. This is also the phase in which S3, the third heart sound, can be heard.
Cardiac cycle phase 6: slow ventricular filling (diastasis)
As the ventricles fill, the pressure difference between atria and ventricles shrinks and flow slows. Ventricular pressure is low, and venous pressure rises slowly as blood continues to return. Then the next P wave starts, and atrial systole begins the cycle again.
Heart sounds and the cardiac cycle
Heart sounds are tied to the valve events above, so you can place each one on the Wiggers diagram without memorising a separate list. The table compares all four.
| Sound | Timing | Cause | Clinical note |
|---|---|---|---|
| S1 | Start of ventricular systole (isovolumic contraction) | Closure of the AV valves | Marks the start of systole |
| S2 | Start of ventricular diastole (isovolumic relaxation) | Closure of the semilunar valves | Coincides with the dicrotic notch |
| S3 | Rapid ventricular filling, after S2 | Associated with rapid passive filling; exact mechanism uncertain | Seen in some healthy young people, athletes and pregnancy; later in life it may point to heart failure |
| S4 | Late diastole, just before S1 | Atrial contraction pushing blood into a stiff or hypertrophied ventricle | Linked to reduced ventricular compliance |
Source: OpenStax 19.3; LITFL.
A common mix-up: where S2 sits
S2 belongs to the start of isovolumic relaxation, when the semilunar valves close. It does not occur during isovolumic contraction. If you place S1 at the start of systole and S2 at the start of diastole, the two sounds bracket systole, and every other sound has a fixed position relative to them.
Murmurs are best understood against this framework, because their timing is described relative to S1 and S2. For grading rules, see the Levine scale murmur grading post.
ECG and JVP correlation with the cardiac cycle
Each mechanical phase is triggered by an electrical event that precedes it. Atrial systole is preceded by the P wave, ventricular contraction by the QRS complex, and ventricular relaxation by the T wave (OpenStax, 19.3). Electrical events always lead the mechanical ones.
The jugular venous pressure tracing is a view of right atrial pressure through the cardiac cycle. The table lists each wave and the event behind it.
| JVP wave | Event | Cardiac cycle phase |
|---|---|---|
| a wave | Right atrial contraction | Atrial systole |
| x descent | Atrial relaxation, following the a wave | Late atrial systole into ventricular systole |
| c wave | Coincides with isovolumic contraction (mechanism debated) | Isovolumic contraction |
| v wave | Atrial filling while the tricuspid valve is closed | Ventricular systole, ending at isovolumic relaxation |
| y descent | Rapid ventricular filling after the tricuspid valve opens | Rapid filling |
Source: MSD Manual, Normal jugular vein waves; LITFL.
A memory aid for the valve states
The simplest aid is to remember that the valves are open or closed in pairs, and that two phases break the pattern. The sequence below is an original study device, not a published mnemonic.
- Atria squeeze: AV valves open, semilunar closed.
- Pressure builds, volume stays: all closed, S1 as AV valves shut.
- Pump out: semilunar open, AV closed.
- Pressure drops, volume stays: all closed, S2 as semilunar valves shut.
- Fill fast: AV open, semilunar closed.
- Fill slow: same valve state, shrinking gradient.
If you can recite this sequence and add "S1 at the end of step 1, S2 at the end of step 3", you have the skeleton of the Wiggers diagram. Then draw the pressure curves over it.
Worked reasoning: using valve states to answer questions
A question stem may give you a phase and ask for a valve state, or give a sound and ask for a phase. The method is the same each time, so practise it as a pattern.
- If a stem says "all valves closed and volume constant", the answer is one of the two isovolumic phases. Look for the clue that separates them: S1 and rising pressure mean contraction, S2 and falling pressure mean relaxation.
- If a stem says "T wave", think of late ejection moving toward isovolumic relaxation.
- If a stem says "dicrotic notch", think of semilunar valve closure and S2.
- If a stem gives a stiff, hypertrophied ventricle and a sound just before S1, think of S4.
You can test yourself on these patterns with the cardiovascular physiology practice questions. For a similar curve-based topic in the same subject, see the oxygen-haemoglobin dissociation curve post.
How to revise the cardiac cycle
Draw the Wiggers diagram from memory once a day for a few days, in this order: the ECG strip, the pressure curves, the volume curve and then the heart sounds. After each attempt, compare against the textbook figure and fix only the points where your valve events are misplaced.
Keep the numbers few. Learn the three volumes (EDV about 130 mL, ESV 50-60 mL, SV 70-80 mL) and the idea that most filling is passive. Let the pressure relationships, not memorised values, carry the rest.
Conclusion
The cardiac cycle is easiest to retain as six phases governed by one rule: valves follow pressure. Two phases have all valves closed and constant volume, S1 and S2 mark the start of systole and diastole, and the ECG waves lead each mechanical event. Redraw the Wiggers diagram from memory, then use the cardiovascular practice questions to check that you can place any sound, wave or valve event on it.
Practise this on Reflex
Turn what you just read into recall with 14 years of tagged PYQs.
FAQ
Frequently asked questions
The questions aspirants ask most about this topic.
Six phases make up the cardiac cycle: atrial systole, isovolumic contraction, ventricular ejection, isovolumic relaxation, rapid ventricular filling and slow ventricular filling (diastasis). Isovolumic contraction plus ejection forms ventricular systole. Isovolumic relaxation plus the two filling phases forms ventricular diastole.
Isovolumic contraction is the phase just after the QRS complex in which the ventricles contract with all four valves closed. Ventricular pressure rises but volume stays constant because the AV valves have shut and the semilunar valves have not yet opened. The first heart sound, S1, is produced when the AV valves close.
Closure of the semilunar valves (aortic and pulmonary) at the start of ventricular diastole produces S2, while S1 comes from closure of the AV valves (mitral and tricuspid) at the start of ventricular systole. The dicrotic notch on the aortic pressure curve falls at the same moment as S2.
S3 is heard during rapid ventricular filling, after S2. It can occur in youth, some athletes and pregnant women, but later in life it may indicate heart failure. S4 is heard late in diastole just before S1, when atrial contraction pushes blood into a stiff or hypertrophied ventricle.
In the OpenStax example, atrial systole lasts about 100 ms, ventricular systole about 270 ms and ventricular diastole about 430 ms. The split between systole and diastole changes with heart rate, so these are example values and not fixed proportions.
In a resting standing adult, end-diastolic volume is about 130 mL, end-systolic volume is 50-60 mL and stroke volume is 70-80 mL. Subtracting end-systolic volume from end-diastolic volume gives the stroke volume.
Stay ahead in your preparation
Get expert tips, exam updates, and high-yield insights delivered straight to your inbox.
No spam. Unsubscribe anytime.
More in Subject Notes
View all → Physiology
Oxygen-Hemoglobin Dissociation Curve for NEET PG: Every Shift Explained
Why the oxygen-hemoglobin dissociation curve is sigmoid, what moves it right or left, and how to apply each shift to fetal hemoglobin, stored blood, altitude and carbon monoxide poisoning.
 Physiology
Reflexes Mnemonic for NEET PG: Deep Tendon and Superficial Reflexes
Nerve root values, the classic root-value mnemonic, and how UMN vs LMN lesions change the reflex pattern.
 Physiology
Tips to Score High in NEET PG/INICET Physiology
Master Physiology for NEET PG/INICET by focusing on conceptual clarity, active MCQ practice, and systematic revision.
 ENT
Cholesteatoma for NEET PG: Safe vs Unsafe CSOM, Complications and Surgery
A revision guide to cholesteatoma: how it differs from safe CSOM, how it forms, which complications it causes, how it is imaged, and how canal wall up and canal wall down surgery compare.